February 1, 2024
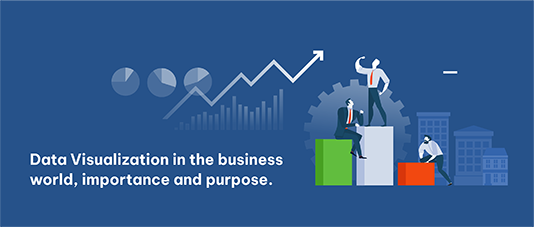
Data Visualization in the Business
World, Importance and Purpose
What is Data Visualization Data?
Data visualization is the practice of translating information into a visual context, to make data easier for the human brain to understand and pull insights from.
It is an element of the data presentation architecture (DPA), which aims to identify, format and deliver data in the most efficient way possible.
Why is Data Visualization Important In Business?
visualization is essential to assist businesses in quickly identifying data trends, which would otherwise be a hassle.
Every professional industry benefit from understanding their data, therefore, data analysis that includes data visualization is branching out to all fields where data exists.
For every business, Visualizing the data enable decision-makers to interrelate the data to find better insights. Whether it is a dashboard, graph, map or chart, etc. all these mediums can be used for visualizing and understanding data.
Importance of data visualization to businesses
can be divided into 2 main points:
can be divided into 2 main points:
1. Help businesses identify which factors affect customer behavior or product sales, pinpoint areas that need to be improved or need more attention through accurate numbers.
2. Asist stakeholders in making thorough decisions in regards to when and where to place specific products or promote certain services in addition to predicting sales volumes.
2. Asist stakeholders in making thorough decisions in regards to when and where to place specific products or promote certain services in addition to predicting sales volumes.

What is The Data Visualization Purpose?
• Better and faster data comprehension
it’s significantly faster to analyze information in graphical format as opposed to analyzing information in spreadsheets. Data visuals present large amounts of information in clear, cohesive ways which allows business to draw thorough conclusions.
• Recognizing relations and patterns
Even extensive amounts of complicated data start to make sense when presented graphically; Identifying those relationships helps organizations focus on areas most likely to influence their most important goals.
• Tell your story
Once a business has uncovered new insights or discovered new trends from visual analytics, the next step is to communicate those insights to others – both in the business and in the market - and gets the message across quickly.
Even though there are many different methods of putting together information in a way that the data can be visualized, An infographic is excellent for exploring complex and highly-subjective topics. If you are in need of some business-beneficial infographics that are easy to be edited,